Drawing Unravelled Persistence Diagrams
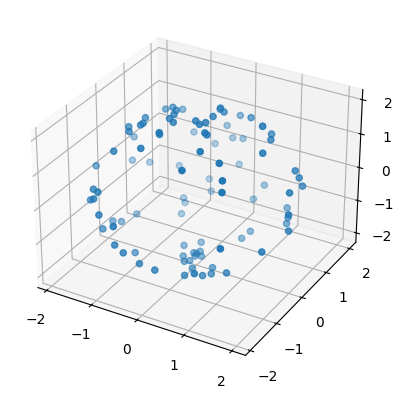
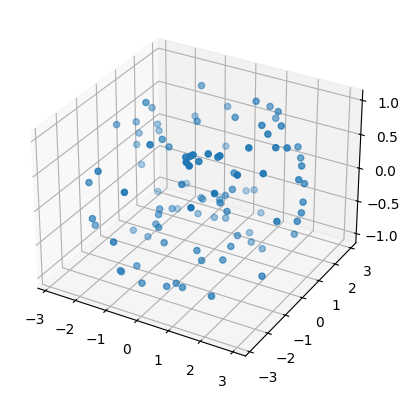
First we create and plot a point cloud of a sphere and of a torus.
from tadasets import sphere, torus, plot3d

my_sphere = sphere( r = 2, n = 100 )
my_torus  = torus( c = 2, a = 1, n = 100 )

plot3d( my_sphere );
plot3d( my_torus  );


Then we compute persistence intervals for each point cloud.
import numpy as np
import torch
import gudhi

simplex_trees = [
    gudhi.AlphaComplex( points = point_cloud ).create_simplex_tree() for
    point_cloud in ( my_sphere, my_torus )
]

[ simplex_tree.compute_persistence() for simplex_tree in simplex_trees ];

persistence_intervals = [
    [ torch.from_numpy(
        np.float32( simplex_tree.persistence_intervals_in_dimension(dim) )
    ) for dim in range(3) ] for
    simplex_tree in simplex_trees
]
Then we complement the notebook to allow us
to draw several unravelled persistence diagrams
without rendering the HTML document invalid
and we instantiate the
class Draw
with its default parameters.
from functools import partial
from persunraveltorch.draw import Draw

Draw.complement_notebook()

draw = Draw()
In order for this to take any effect you may have to press this button:
Then we draw unravelled persistence diagrams
corresponding to the previously created point clouds
using the arctan function to map all intervals
into the range between 0 and π/2.
(You can choose different bounds when instantiating
Draw
using the range_intervals keyword argument.)
draw( list(
    map( partial(map, torch.atan), persistence_intervals )
) )
Then we draw the same diagrams again except that we scale all persistence intervals with a factor of 1.7 before applying arctan.
draw( list(
    map(
        partial(map, lambda intervals_d: torch.atan(1.7 * intervals_d)),
        persistence_intervals
    )
) )
Finally, we save the first version as a standalone SVG file.
with open('unravelled-diagrams.svg', 'w') as svg_file:
    svg_file.write(
        draw(
            standalone = True,
            intervals = list(
                map( partial(map, torch.atan), persistence_intervals )
            )
        )
    )